


Introduction
Legacy modernization projects fail to get funded for one reason more than any other: the business case is vague. Engineering teams know the old system is painful, but they struggle to translate that pain into numbers that finance and executive leadership can act on. The result is a cycle of deferred maintenance, rising operational costs, and growing risk.
This framework gives you a structured approach to building a modernization business case that holds up to scrutiny. It covers the full cost picture, quantifies benefits across multiple dimensions, and provides a decision matrix to help you choose the right modernization strategy for your situation.
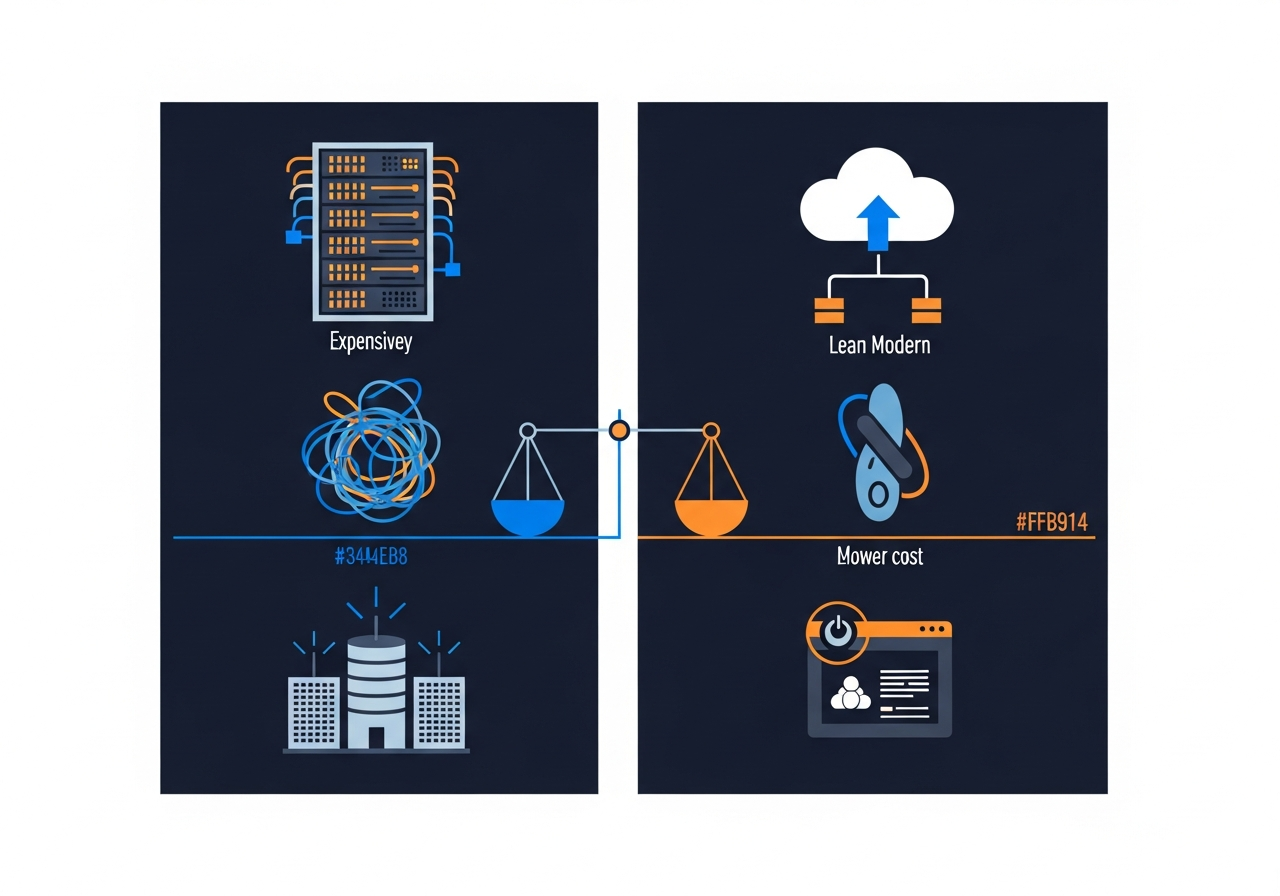
Step 1: Quantify current run costs
Before you can calculate ROI, you need to know what the legacy system actually costs today. Most organizations significantly underestimate this number because costs are distributed across teams and budget lines.
Direct infrastructure costs
- Hosting and compute: Server costs, licensing fees for legacy platforms, database licensing, and storage.
- Support contracts: Vendor support agreements for end-of-life software, extended security patches, and proprietary middleware.
- Networking and security: VPN costs, firewall appliances, and compliance-related infrastructure that exists solely to protect the legacy stack.
Operational labor costs
- Maintenance engineering: Hours spent on bug fixes, patches, and workarounds. Track this for at least 3 months to get a reliable baseline.
- Manual processes: Tasks that should be automated but cannot be due to system limitations - data entry, report generation, manual reconciliation.
- Incident response: On-call burden, mean time to resolution for legacy-specific incidents, and post-incident review time.
- Onboarding overhead: How long does it take a new developer to become productive on the legacy system versus a modern stack?
Hidden costs
- Opportunity cost of slow delivery: Features that take weeks on the legacy system but would take days on a modern platform. Estimate the revenue or efficiency impact of delayed capabilities.
- Integration tax: Custom adapters, middleware, and glue code required to connect the legacy system with modern services.
- Compliance and audit burden: Extra effort required to demonstrate compliance when the system lacks modern logging, access controls, or audit trails.
Step 2: Estimate migration costs
Be honest about what modernization will cost. Underestimating migration costs is the fastest way to lose credibility with leadership.
One-time migration costs
- Discovery and planning: Architecture assessment, data mapping, and migration strategy development. Budget 10-15% of total project cost.
- Development: Building the new system, including feature parity, data migration, and integration work.
- Data migration: Extracting, transforming, and loading data from legacy formats. This is almost always harder than expected.
- Testing: End-to-end testing, user acceptance testing, performance testing, and regression testing.
- Training: User training, documentation updates, and change management activities.
- Parallel running: The period where both old and new systems operate simultaneously. Budget for double infrastructure costs during this window.
Ongoing costs post-migration
- New platform operating costs: Cloud infrastructure, SaaS licensing, monitoring tools.
- Reduced but non-zero maintenance: Modern systems still require maintenance - just less of it.
Step 3: Map the benefit categories
Benefits fall into four categories. Quantify as many as possible; acknowledge the rest as qualitative advantages.
Operational savings (hard dollars)
- Infrastructure cost reduction: Modern cloud-native architectures typically reduce infrastructure costs by 30-50% compared to on-premise legacy setups.
- Reduced maintenance labor: Teams spend less time fighting the system and more time building features.
- Automation of manual processes: Tasks that required human intervention can be automated with modern tooling.
Developer productivity (measurable)
- Faster feature delivery: Measure current feature cycle time and project improvement based on modern stack benchmarks.
- Reduced onboarding time: New developers become productive in weeks instead of months.
- Lower defect rates: Modern testing frameworks, type systems, and CI/CD pipelines catch issues earlier.
Risk reduction (quantifiable with assumptions)
- Security risk: Legacy systems with unpatched vulnerabilities represent quantifiable risk. Estimate the cost of a breach using industry benchmarks.
- Compliance risk: Fines, audit findings, and contract penalties associated with non-compliant systems.
- Vendor risk: Dependence on vendors who may discontinue products or raise prices dramatically.
- Key-person risk: Legacy knowledge concentrated in a small number of engineers who may leave.
Strategic value (qualitative)
- Market responsiveness: Ability to ship new capabilities faster than competitors.
- Talent acquisition: Modern stacks attract stronger engineering candidates.
- Partnership readiness: Modern APIs and integration patterns enable partnerships that legacy systems block.
Step 4: Build the timeline model
ROI is time-dependent. A project that pays back in 18 months is a different decision from one that takes 4 years.
Phase the migration
- Months 1-3: Discovery, architecture design, and pilot scope definition.
- Months 3-9: Build core platform, migrate first workload, validate assumptions.
- Months 9-18: Migrate remaining workloads, decommission legacy components incrementally.
- Months 18-24: Complete decommissioning, realize full operational savings.
Calculate cumulative ROI
- Month 0: Starting point - current annual run cost is your baseline.
- Migration period: Costs increase as you pay for both systems plus migration effort.
- Crossover point: The month where cumulative savings exceed cumulative migration investment.
- Steady state: Ongoing annual savings versus the pre-migration baseline.
Most well-planned modernization projects reach the crossover point between 18 and 30 months after kickoff.
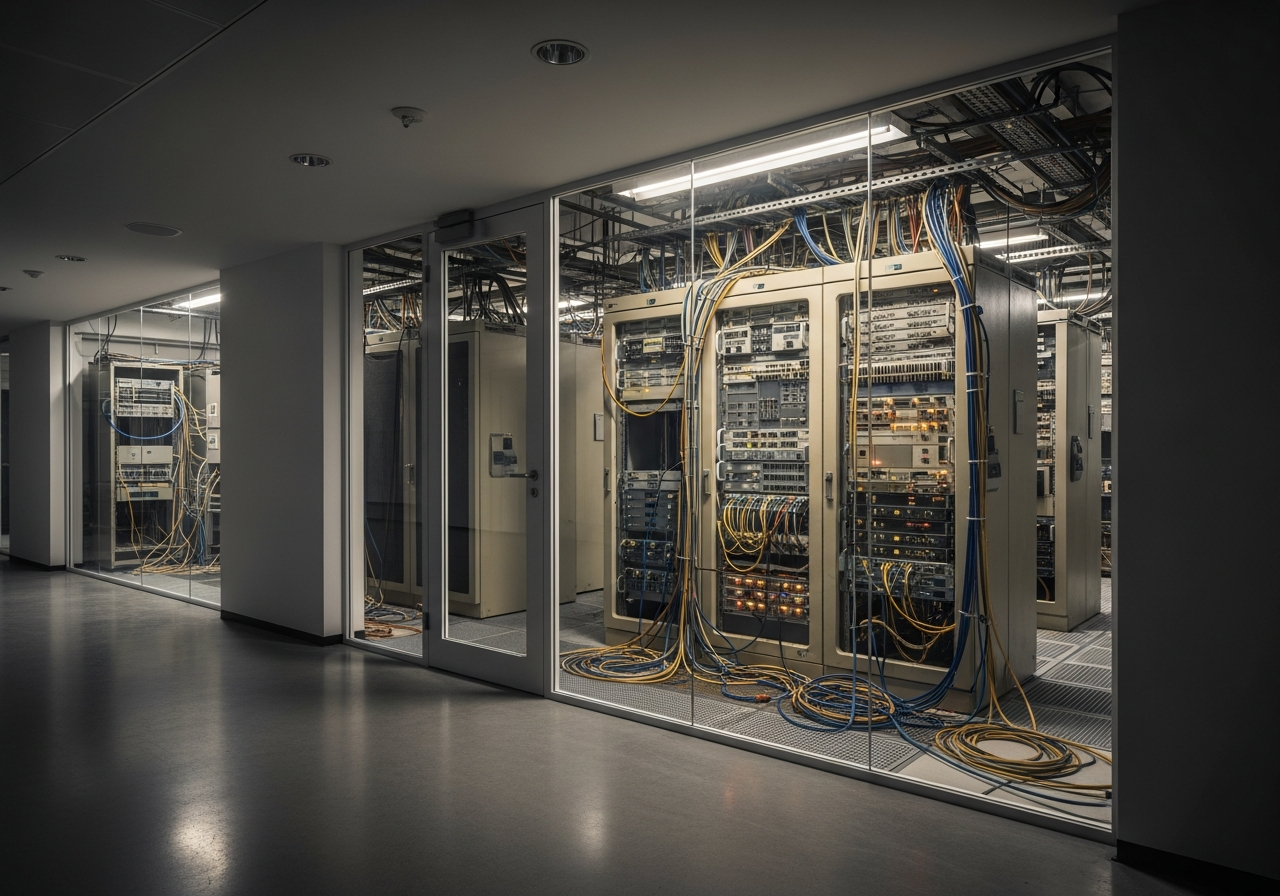
Step 5: Use the decision matrix
Not every legacy system should be modernized the same way. Use this matrix to choose the right strategy.
Rehost (lift and shift)
- Best when: The system works well functionally but infrastructure is the problem.
- ROI profile: Low investment, moderate savings, fast payback.
Replatform (lift and reshape)
- Best when: The core logic is sound but the platform is outdated. Swap the database, containerize the app, modernize the deployment pipeline.
- ROI profile: Medium investment, good savings, 12-18 month payback.
Refactor (re-architect)
- Best when: The system needs significant structural changes to support new requirements. Extract services, redesign data models, rebuild key interfaces.
- ROI profile: High investment, high savings and strategic value, 18-30 month payback.
Rebuild
- Best when: The existing codebase is unmaintainable, undocumented, or built on a dead platform. Starting fresh is cheaper than untangling the mess.
- ROI profile: Highest investment, highest long-term value, 24-36 month payback.
Retire
- Best when: The system’s functionality is no longer needed or can be replaced by an off-the-shelf product.
- ROI profile: Immediate savings with minimal investment.
Presenting the business case
Package your analysis into three layers:
- Executive summary: One page with current annual cost, projected annual cost post-migration, total migration investment, and payback period.
- Detailed model: Spreadsheet with monthly projections, assumptions clearly stated, and sensitivity analysis for key variables.
- Risk register: What could make the project cost more or take longer, and what mitigations are in place.
Ready to build your modernization business case with real numbers? CoreLine’s legacy modernization services include a structured assessment that gives you the cost model, risk analysis, and migration roadmap you need to get executive buy-in.